Why AdBlock revenue losses estimates are complete bullshit
No one seems to agree on the actual losses due to adblocking. Instead of informing a critical debate about the future of web advertising, and more broadly, online monetization, I would argue that recent estimates mostly serve the agendas of companies selling adblock mitigation services.
These studies disregard basic statistical analysis principles and come up with impressive numbers derived from absurd averages. Since adblocking is a hot topic, I believe they are primarily driven by quick-win PR strategies, because anyone with a basic understanding of online advertising should notice major flaws.
Flawed methodologies
Take the following equation for yearly losses per site:
(blocked elements) x $0.42 CPM x (country blocking rate) x (page views) x 12
The result depends on too many assumptions.
Blocked elements: Unless you have crawled a statistically significant sample of pages per site to get a significant average of ad slots, per device categories (desktop, tablet, mobile), this number is worthless. Not to mention that ad slots hold very different values, especially display VS video.
For a skewed data distribution, median is a better measure of center. For any reasonably symmetric distribution with no outliers, mean is a better measure of center. - Introductory Statistics1
Average CPM: CPMs depend on a ton of factors (industry, ad format, ad placement, time of the year, etc.) and most importantly, a simple multiplication doesn’t account for diminishing returns: increasing the number of ads on a page doesn’t increase your revenue opportunity linearly and, conversely, your losses due to adblock. Using a single rounded global CPM from 20152 is lazy. Would you think for instance that IMDB, the #1 movie site, is selling custom advertising campaigns for the average market CPM?
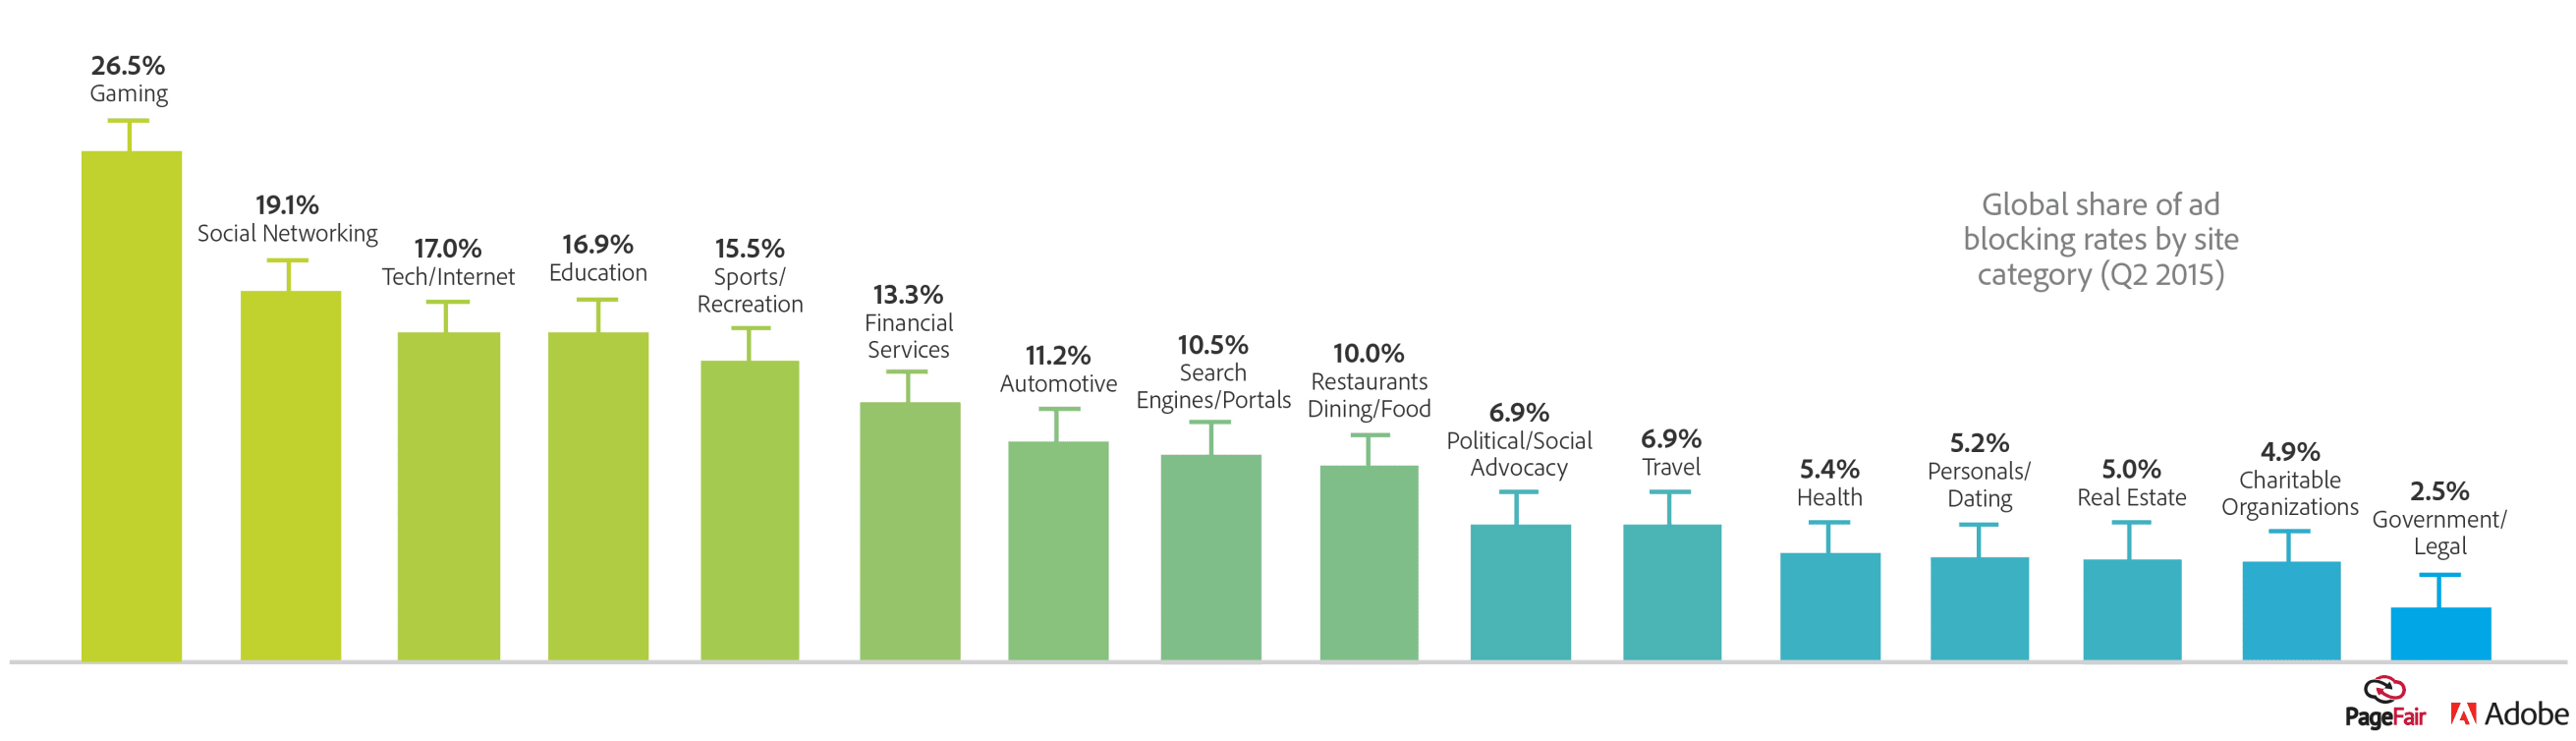
Country adblocking rate: PageFair is the global authority when it comes to adblock penetration per country. They even publish specific rates per category plus user demographics. Unfortunately, I have yet to see a study using this information as a corrective weighting.
Pages views: You can get traffic data from a number of competitive intelligence tools, but caveats apply. In June 2015, Moz, a leading SEO firm, benchmarked their accuracy and was rather disapointed. Considering that even first party analytics and certified metrics must be corrected to account for blockers, traffic estimates should be cross-referenced.
“I wouldn’t feel confident using any of these numbers to predict actual traffic. In particular, I’m baffled by the number of otherwise savvy marketers, investors, and business people who continue to rely on Alexa data.” - Rand Fishkin, Moz Co-founder.
Closing words
These are not studies but data mashups. Unless we finally research this issue with proper hypotheses and limited assumptions, the true cost of adblocking will remain unknown. This is a topic with serious implications, that is bound to drive deep changes with more activity happening server side to circumvent both the blockers and privacy directives3, which may lay waste to a distorted ad market that’s too reliant on data and intermediaries.
I am flabbergasted that an industry so hyped on big data and data science has settled for poorly grounded estimates. An ideal way to look at this issue would rely on revenue per user, per categories. Estimating ARPU is tough, yet this is how analysts work, and there’s plenty of pricing data available4 for us to come up with finer estimates per categories. Plus, CPM based calculations don’t translate in actual RPM losses for publishers. Oh, and when estimating, it’s okay to give ranges, rather than questionable grand totals.
Disclaimer: I am currently the CTO of SQweb, a french company tackling adblock measurement since 2013. We’ve worked with hundreds of publishers, large and small, with blocking rates ranging from 5% to 37%. Many of them feel completely left out of this conversation because they can’t identify with current estimates considering their actual losses.
-
Read “When Bill Gates walks into a bar” for a great primer on resistant measure. ↩
-
In this particular estimate, the CPM is from “an internal [AppNexus] study published in 2015”. ↩
-
Companies use code to break the law. Google was fined $22.5M for bypassing privacy settings. ↩
-
For a rough idea of CPM distribution per categories, see Salesforce’s quarterly Advertising Index. ↩